


Dickson Support Database
Understand the Device Graph
About Understanding the Device Graph #
- The Device Graph can provide users insightful information such as Excursion flags, the ability to create Annotation flags, display different data ranges and more all on the graph.
How to Understand the Device Graph #
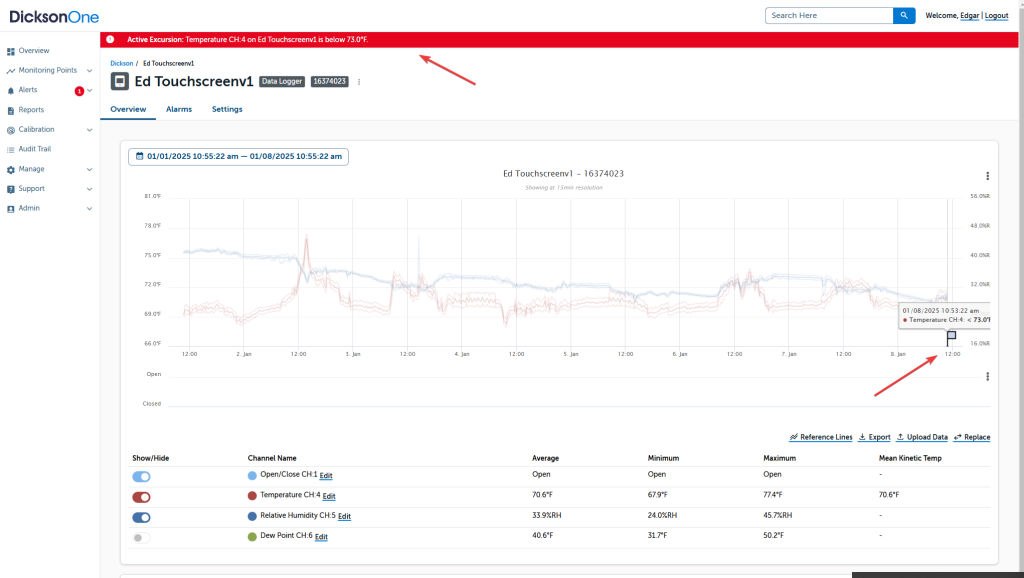
Displaying the Data on the Graph: #
- Click on the date picker to determine a display a different range of data
- By hovering over the screen, you can look at a data point on the graph
- A timestamp for the data point that the cursor is on will be displayed on the top-right
- You can hide other channels by sliding the toggle to Off to display only desired channels on the graph

Zoom Into the Graph: #
- Highlight an area on the graph by clicking into the graph and dragging the cursor to zoom into a range of data
- Click Reset Zoom to reset the zoom

#

Warnings and Excursions on the Graph
- Excursion events will add excursion flags on the graph and you can click into it to view more details
- An excursion banner will be displayed when an alarm event for an excursion is triggered and will remain displayed until the condition clears
- A warning banner will be displayed when an alarm event for a warning is triggered and will remain displayed until the condition clears
Info
Users have the flexibility to designate alarm alerts as either warnings or excursions. Warnings are typically used to receive a notification when a condition is trending out of spec, but has not reached a critical point. Excursions are typically used to alert the user when the condition has reached a critical point. All warning and excursion events will be documented in the system. However, only excursions will display a flag on the graph and appear on export and reports. Warnings will not.
Annotations on the Graph #
Users can add Annotation flags by clicking into the graph and the Annotation pop-up will be displayed
- Select the Channel from the drown-down to comment on
- Create a message/comment
- Click Save

There are various options that can be displayed on the Device Graph. To learn more information, such as how to add Reference Lines to the graph or other features, please visit the DicksonOne Knowledge Base.