


Precision, durability, and over 100 years of expertise
When it comes to monitoring temperature, humidity, or pressure, engineers worldwide trust Dickson Chart Recorders. With over a century of manufacturing excellence, our reliable chart recorders are built to capture accurate data that you can depend on.
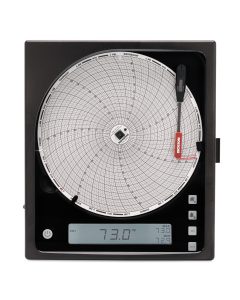
8″ Chart Recorder
8″ Pressure Chart Recorder
8″ (203mm) Chart Recorders offer the largest resolution out of any chart recorders.
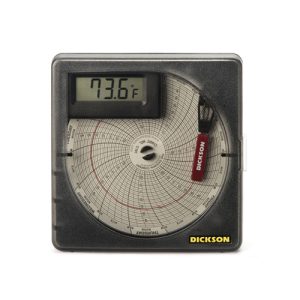
4″ Chart Recorder
A great size coupled with 2-3 year battery life makes this 4-inch (101mm) temperature chart recorder a great solution.

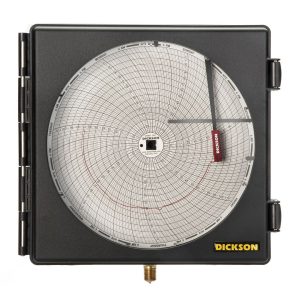
4″ Pressure Chart Recorder
Our 4-inch (101mm) line of recorders produces a permanent visual record of your variable pressure data.

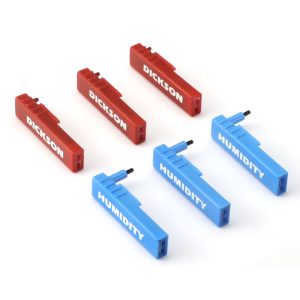
Chart Recorder Pens
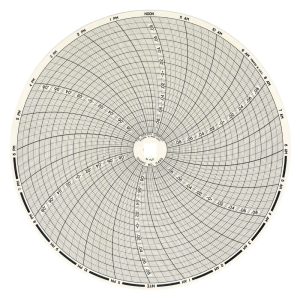
8-Inch Charts (60pk)
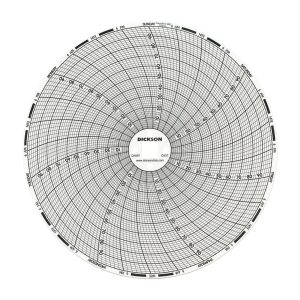
6-inch Charts (60pk)
4-Inch Charts (60pk)

3-inch Charts (60pk)
Related Blog Posts
Sorry, we couldn't find any posts. Please try a different search.
Why Choose Dickson Chart Recorders?
Dickson has been the leader in chart recorder technology for more than 100 years. Designed for engineers who demand accuracy and consistency, our chart recorders are backed by extensive expertise and rigorous quality standards.
Benefits of Choosing Dickson
- Reliability You Can Trust – Our chart recorders are precision-engineered to deliver accurate readings, even in demanding environments.
- Versatility in Monitoring – Measure humidity, temperature, or pressure seamlessly with models tailored to your needs.
- Calibrated By the Experts – Every recorder is calibrated directly by Dickson for assurance of optimal performance. Single or multiple A2LA calibration point certificates are available for all chart recorders and sensors.
When precision matters, Dickson delivers.

Temperature Chart Recorders
Our temperature chart recorders help you track and document environmental changes. Shop and learn more about our devices.

Humidity Chart Recorders
Our humidity chart recorders are ideal for physical records to present during audits, use for quality control & ensure compliance.

Pressure Chart Recorders
Precise pressure control is critical in many industries. Explore and shop our reliable pressure chart recorders to enhance precision and operational efficiency within your organization.
Optimize Accuracy with Our Chart Recorder Calibration Services and our Calibration Club
Proper calibration is essential to ensure your chart recorders are delivering accurate data over time. Dickson offers in-house calibration services performed by our expert technicians. This guarantees compliance with industry standards and peace of mind that your equipment is working at peak performance.
High-Quality Chart Recorder Pens and Papers
Elevate your chart recorder performance with purpose-made pens and papers from Dickson. Our consumables are designed specifically to work seamlessly with our chart recorders, providing clear, precise results every time.
What We Offer
- Durable Recorder Pens – Smooth, precise marking for accurate data records.
- Premium Chart Papers – High-quality paper engineered for optimum readability and durability.
Stock up on the necessary supplies to keep your data reliable and presentable.
Frequently Asked Questions
What key features should I consider in a temperature recorder?
+Chart recorder size: Choose between smaller 4” models that can accomodate physical space requirements and utilize replaceable batteries and the larger 8” models with AC power and higher reading resolution.
Recording range: Ensure the recorder covers the necessary temperature range for your application.
Accuracy: Verify the device’s precision, especially for sensitive environments.
Durability: Look for models built for the specific conditions of your use, such as humidity or dust resistance. Look for features such as polycarbonate casings to ensure durability.
Calibration: Temperature and humidity sensors will drift over time. Consider a chart recorder that offers ongoing OEM calibration.
What is the maximum pressure they can measure?
+1000 PSI
Why use a temperature chart recorder over digital alternatives?
+Chart recorders offer a simple, tangible way to record data without requiring software, batteries, or network connectivity. They’re ideal in situations where reliability and simplicity are more critical than advanced analytics. For regulated environments, chart recorders are often compliant with standards that mandate hard-copy documentation. Additionally, chart recorders work well in settings where digital access is limited or where electronic data loggers may be challenging to deploy.
Are there digital alternatives to pressure recorders?
+Yes, digital data loggers offer electronic pressure monitoring such as the PR-125 with features like real-time data access, higher accuracy, and easier data management.
How does a temperature chart recorder work?
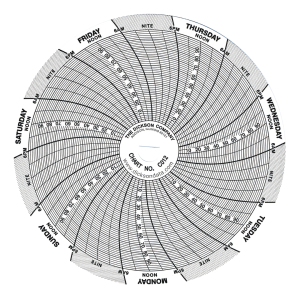
+A temperature chart recorder is a device used to monitor and document temperature changes over time. It has a temperature and/or humidity sensor connected to a mechanical arm with a pen, which moves across a circular chart paper. As the temperature and humidity fluctuates, the pen records these changes on the paper, creating a visual timeline of temperature data. This physical chart serves as a direct record, often used for regulatory or quality control purposes in settings like laboratories, cold storage, or pharmaceuticals. The used charts are often dated and signed to create a representative snapshot for the time period indicated.
What is a temperature chart recorder?
+A temperature chart recorder is a device used to monitor, measure, and record temperature data over time. It typically consists of a temperature sensor, a recording mechanism, and a chart or digital display for visualizing the temperature data. These devices are commonly used in industries where precise temperature monitoring is critical, such as healthcare, food storage, manufacturing, and environmental monitoring.
What is a pressure chart recorder?
+A pressure chart recorder is an instrument that continuously monitors and records pressure levels over time onto a circular chart. This provides a visual representation of pressure fluctuations, aiding in system diagnostics and compliance documentation.
Can I use the same charts and pens for humidity, temperature, and pressure recorders?
+Dickson chart recorders are designed to monitor multiple parameters, such as temperature and humidity. It’s essential to use charts and pens that are specifically designed for your recorder to ensure accurate readings. For instance, Dickson provides charts and pens tailored to their recorders, and using genuine Dickson charts is required for accurate readings. Pens are available in blue and red to designate humidity and temperature. Pens can be purchased in 6-packs of either blue or red, or a combination pack (3 red, 3 blue).
How do pressure recorders work?
+Pressure recorders utilize sensors to detect pressure changes. These changes move a pen across a rotating chart, creating a continuous trace that reflects pressure variations over a set period, such as 24 hours or 7 days.
What should I do if my chart recorder pen isn’t working properly?
+Step 1: Inspect the Pen. Check for any visible damage or ink depletion.
Step 2: Replace the Pen. If the pen is out of ink or damaged, replace it with a compatible one. For example, Dickson offers replacement pens for their recorders.
Step 3: Check Alignment. Ensure the pen is properly aligned and making contact with the chart paper.
Step 4: Consult the Manual. Refer to your recorder’s user manual for troubleshooting tips specific to your model.
Step 5: Check the Dickson knowledge base.
How do you use and read pressure chart recorders?
+Setup: Install the recorder at the desired monitoring point, ensuring a secure connection to the pressure source.
Chart Installation: Place a new chart on the device, aligning it with the current time.
Operation: Activate the recorder to begin monitoring.
Reading: After the recording period, remove the chart. The pen’s trace indicates pressure levels over time, with the chart’s time markings helping to correlate pressure changes to specific intervals.
How often do I need to replace the charts and pens on my chart recorder?
+Charts: Replace the chart after each recording cycle, which could be daily, weekly, or monthly, depending on your recorder’s settings.
Pens: The lifespan of a pen varies based on usage and environmental conditions. Pens can typically last from six months to one year. Regularly inspect the pen’s ink level and writing quality, and replace it when the ink is depleted or the writing becomes faint.
What key features should I consider when choosing a recorder?
+Pressure Range: Ensure the device can measure the expected pressure levels in your application. Select an appropriate option for pressures ranging from 100-1000 PSI.
Chart Size and Duration: Select appropriate chart dimensions and recording durations (e.g., 24-hour or 7-day) based on monitoring needs. For more detailed resolution, shorter time frames are suggested.
Durability: Opt for recorders with robust enclosures, especially for harsh environments. Dickson pressure chart recorders feature a rugged black ABS case, polycarbonate door, and aluminum dials.
Power Source: Decide between battery-operated or externally powered units based on portability and installation constraints.
Can I use any chart with my recorder or does it have to be brand-specific?
+It’s crucial to use charts that are compatible with your specific recorder model. Using non-compatible charts can lead to inaccurate readings and potential damage.
How accurate are pressure chart recorders?
+Accuracy varies by model. For instance, Dickson’s 8-inch pressure chart recorders offer a resolution of .1.
How do I install a new chart in my recorder to ensure proper alignment?
+To install a new chart correctly:
- Remove the Old Chart: Lift the pen arm away from the chart and remove the old chart.
- Place the New Chart: Align the new chart on the chart hub, ensuring it’s centered and secure.
- Set the Time: Rotate the chart hub to align the current time with the time indicator on the chart.
- Lower the Pen Arm: Gently place the pen arm back onto the chart to resume recording.
Can pressure recorders also record temperature and humidity?
+Dickson offers chart recorders for temperature and humidity, as well as models that monitor pressure separately. Dickson does not provide a chart recorder that simultaneously monitors temp/humidity and pressure.
How do I replace the pen on my chart recorder?
+To replace the pen:
- Lift the Pen Arm: Gently raise the pen arm away from the chart.
- Remove the Old Pen: Detach the old pen from its holder.
- Install the New Pen: Attach the new pen securely into the holder.
- Lower the Pen Arm: Place the pen arm back onto the chart to resume recording.
Always use Dickson chart pens with your recorder model to ensure accurate recordings.
What is the pressure range of Dickson’s chart recorders?
+Dickson’s pressure chart recorders cover various ranges, including 0-100 PSI, 0-200 PSI, 0-300 PSI, and up to 0-1000 PSI, catering to diverse monitoring requirements.
Are there different sizes of charts available?
+Yes, chart recorders come with various chart sizes, commonly including 4-inch, 6-inch, 8-inch, and 12-inch diameters. The appropriate size depends on your recorder model and monitoring needs.
How do I calibrate a pressure chart recorder?
+Calibration involves comparing the recorder’s readings against a known standard and adjusting as necessary. It’s recommended that Dickson calibration services be utilized for yearly or bi-yearly adjustments depending on your standard operating procedures.
Can I reuse charts?
+Charts are designed for single-use to ensure accurate and clear recordings. Reusing charts can lead to overlapping data, making interpretation difficult and potentially compromising data integrity. It’s recommended to use a new chart for each recording cycle.
Are recorders durable enough for high pressure environments?
+Many pressure chart recorders are designed for high-pressure applications. For instance, Dickson’s 8-inch pressure chart recorders are built to withstand demanding conditions up to 1000 PSI.
Can I record temperature and humidity on the same chart?
+Yes, Dickson chart recorders are designed to record both temperature and humidity on the same chart. These dual-function recorders have two separate (red and blue) pens, each tracking a different variable, and are often used in environments like cold storage or laboratories where both temperature and humidity control are critical.
How often do pressure recorders need to be replaced?
+With proper maintenance and calibration, pressure chart recorders can function effectively for many years. Regular calibration and timely replacement of consumables, like pens and charts, are essential for longevity.
How to calibrate a temperature chart recorder?
+Calibration typically involves:
- Comparing the recorder’s readings with a known, accurate reference thermometer.
- Adjusting the chart recorder’s sensor until its readings match the reference.
Dickson offers calibration on all of our sensors to ensure ongoing accuracy. Sensors can be swapped at pre-defined intervals so there is no downtime.
Do pressure recorders require external power?
+Many pressure chart recorders are battery-operated, offering portability and ease of installation without the need for external power sources. For example, Dickson’s 4-inch pressure chart recorders operate on a single AA battery. The 8-inch model utilizes an AC adapter.
How can I ensure the accuracy of my temperature chart recorder?
+Regular calibration is key to maintaining accuracy. Chart recorders should be recalibrated at intervals in alignment with your standard operating procedures (usually yearly or bi-yearly). It’s also important to place the recorder in an area free from interference like direct sunlight, heat sources, or drafts, as these can impact readings.
How can I ensure my pressure recorder is functioning properly?
+Regular Calibration: Schedule periodic calibrations to maintain accuracy.
Routine Maintenance: Inspect the device for wear, replace consumables like pens and charts, and check battery levels.
Performance Checks: Compare recorded data against known standards to verify functionality.