


Temperature and humidity mapping is one of the most consequential studies your team will conduct. Yet even experienced teams routinely stumble on the same seven mistakes. From skipping a written test plan to treating mapping as a one-time exercise, any one of them can compromise your dataset and put your compliance program at risk.
Mistake #1: Starting Without a Written Test Plan
Before a single temperature probe, sensor, or data logger is installed, you need to identify and define:
- Location of critical mapping areas
- Equipment calibration certificates and expiration dates
- Data logging sample interval
- Study length
- Temperature data logger placement rationale
- Acceptance criteria
What you document should match exactly what you execute. Any deviation must be noted or the study won’t hold up under scrutiny.
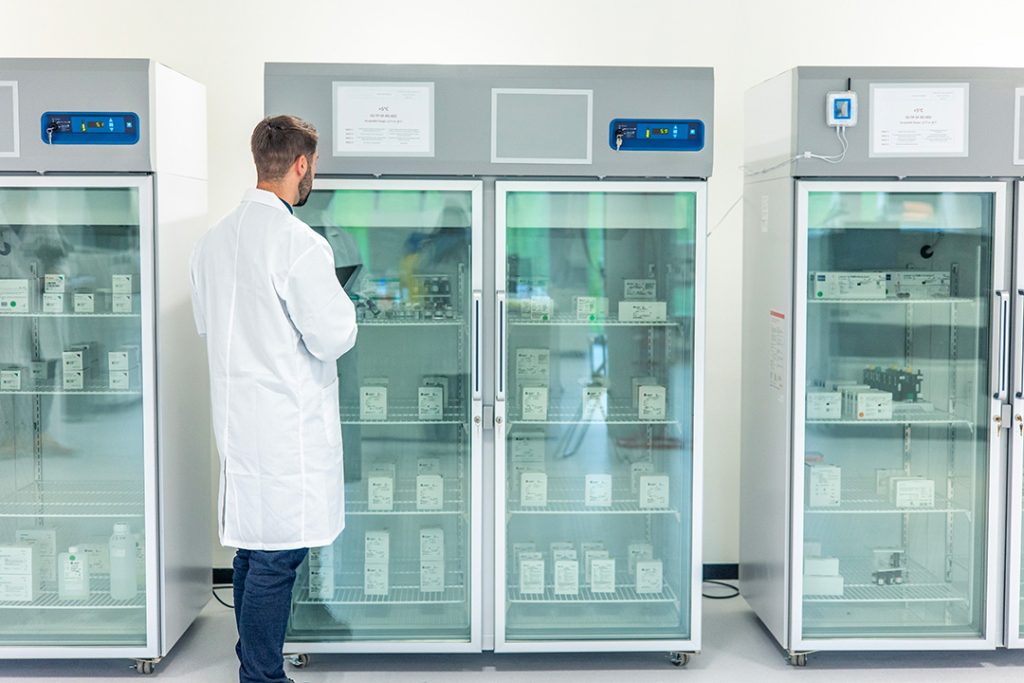
Mistake #2: Poor Sensor Placement
Temperature and humidity sensor placement is where even experienced teams cut corners. The most common errors include:
- Clustering loggers at a single height rather than across the top, middle, and bottom planes of the space
- Skipping ceiling areas, exterior walls, compressed racking or shelving that blocks airflow, and areas near HVAC vents, fans, or furnaces
- Ignoring high-risk boundary points like windows and doors, which can dramatically skew readings when left open or poorly insulated
World Health Organization (WHO) guidance recommends placing loggers 5-10 meters apart. Dickson’s own practice is to place them every 7 to 9 meters (approximately 25 to 30 feet), distributed three-dimensionally across each zone.
Mistake #3: Skipping Pre- and Post-Calibration
If you can’t prove your loggers were accurate before and after the study, you can’t defend the data they collected.
Calibrate your temperature and humidity sensors to a national standard before the study and perform a post-calibration verification once loggers are retrieved. Both steps matter because they give you documented proof that the devices were accurate from start to finish, which is exactly what auditors look for.
If you’re operating under EU GDP guidelines, confirm your loggers meet applicable electronic records and data integrity requirements, and that your calibration provider holds ISO/IEC 17025 accreditation.
Mistake #4: Mapping Under Non-Representative Conditions
Your mapping data is only as valid as the conditions under which it was collected. Two scenarios consistently produce misleading results:
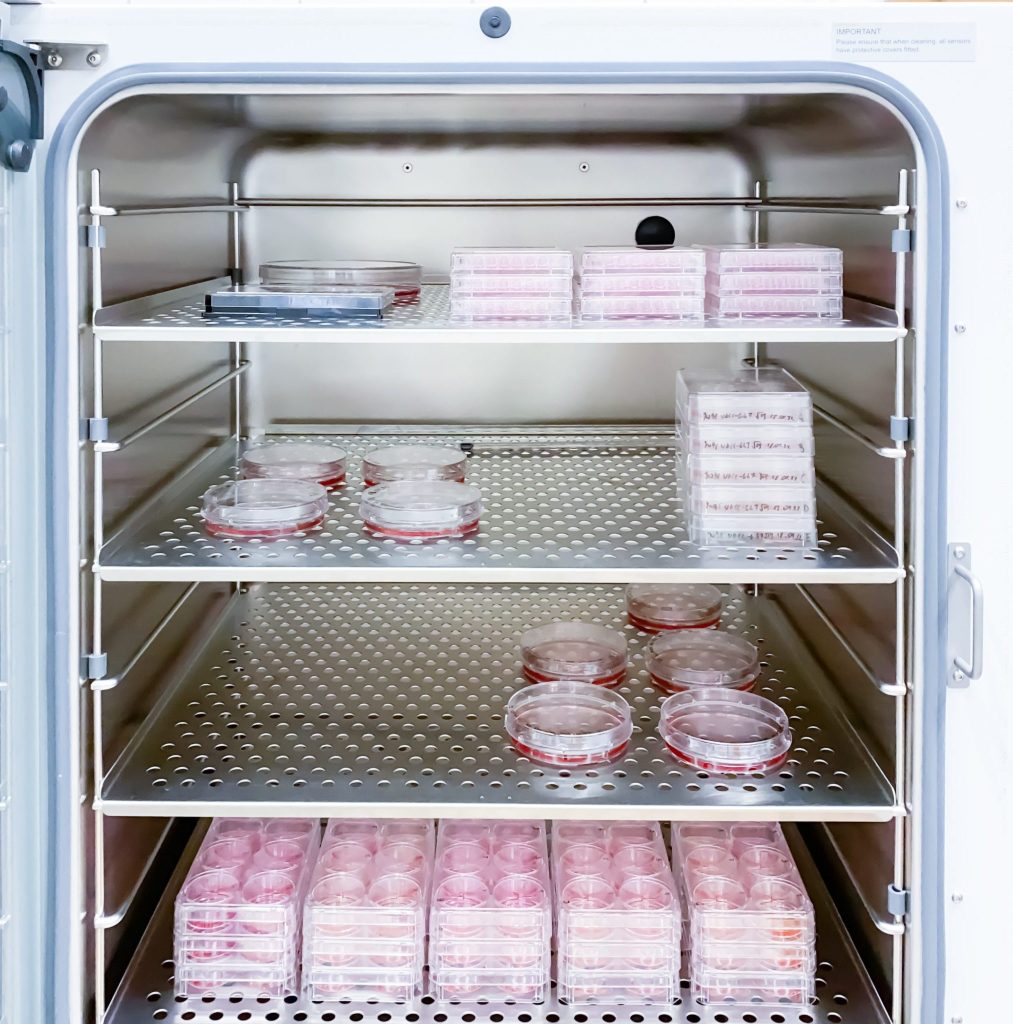
Partial load conditions: A nearly empty warehouse circulates air very differently than a fully stocked one. Always map under typical operational load because hot spots hidden by full shelving won’t show up any other way.
Seasonal extremes: An HVAC system that holds temperature in April may struggle in July heat or a January cold snap. Map in both warm and cold seasons to confirm your environmental controls can handle real-world conditions year-round.
Mistake #5: Choosing the Wrong Data Logger for the Job
Before selecting your data loggers, confirm:
- Accuracy: WHO guidelines require loggers to measure within ±0.9°F (±0.5°C). Make sure your data loggers hit that mark across your full temperature range, not just at room temperature.
- Data capacity and sample rate: Your loggers need enough memory to run continuously for the full study period, which is often several weeks.
- Battery life: In large spaces where power outlets are scarce, battery life matters. Most battery-powered loggers can last 1 to 5 years.
- Connectivity: If you’re logging to a cloud-based platform, make sure the Wi-Fi, Ethernet, or cellular network reaches every zone where a logger will be placed.
- Size: Logger dimensions vary widely. A unit that works in an open warehouse may not fit in a chamber or compact cold storage unit.
Mistake #6: Inadequate Study Period Documentation
Logging the data is only part of the job. Any changes that occur during the study period need to be noted in real time, including:
- Personnel accessing stored areas
- HVAC maintenance or adjustments
- Equipment changes or failures
Those notations give you and your auditors the context to explain anomalies rather than scramble to account for them later.
Mistake #7: Treating Mapping as a One-Time Exercise
Your facility is dynamic, not static. Over time, your environment will naturally change.
- Inventory shifts: The types, volumes, and storage requirements of your products will fluctuate.
- Equipment ages: HVAC systems lose efficiency and wear down.
- Layouts evolve: Renovations and racking updates alter airflow patterns.
- Weather fluctuates: Seasonal conditions introduce new stress on your environmental controls.
For these reasons, temperature mapping must be an ongoing process that accounts for both internal facility modifications and external seasonal variations.
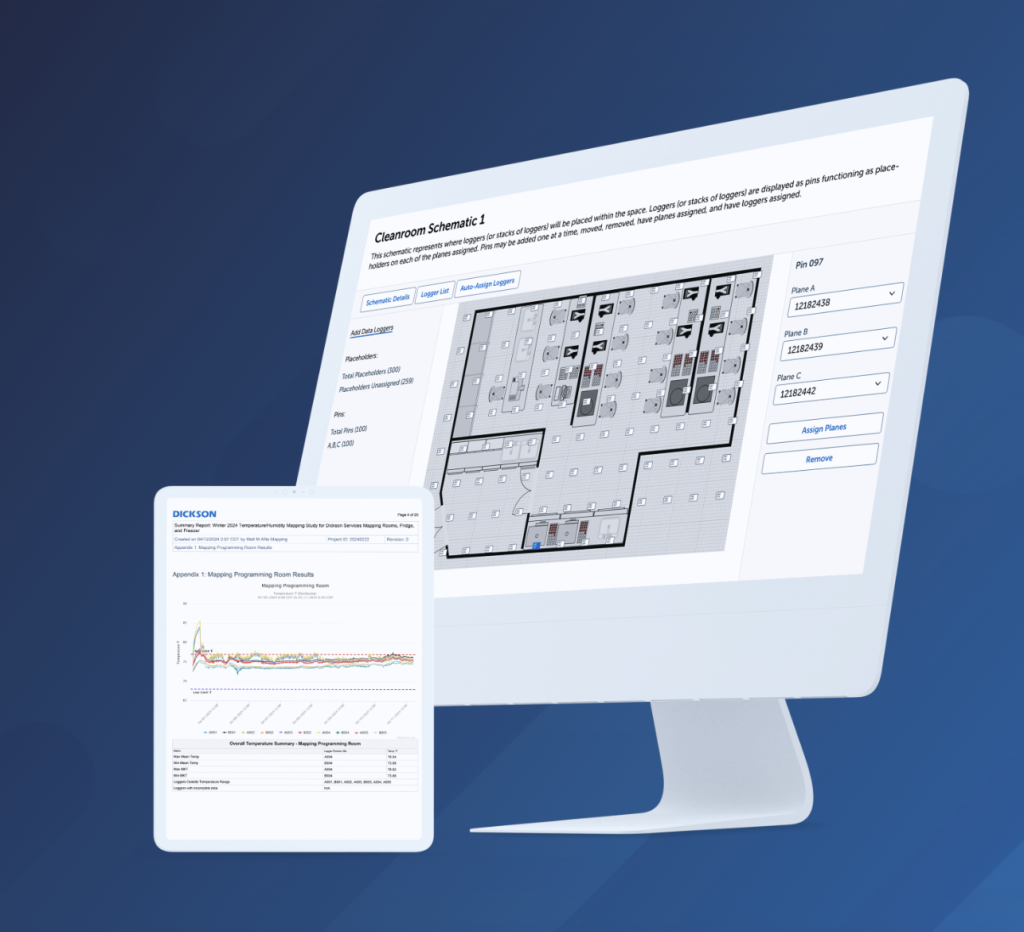
How Dickson’s Mapping Suite Helps Prevent Mistakes
Knowing the pitfalls is step one. Having a team and process in place to avoid them is step two. That’s where Dickson’s Mapping Suite comes in.
Every study follows the same proven process:
- Discovery: Consultation to understand your regulatory requirements and identify critical zones
- Test planning: Detailed study plan aligned with WHO, ISPE, and FDA guidelines
- Logger selection and calibration: Devices selected and calibrated specifically for your environment
- Data collection and analysis: Data gathered over the full study period, then thoroughly analyzed
- Post-calibration: Loggers verified for accuracy after retrieval to validate the data
- Final report: Expert analysis, trend summaries, corrective action recommendations, and guidance on final temperature and humidity sensor placement
Whether you operate in pharmaceutical manufacturing, healthcare, food and beverage, or another regulated industry, Dickson’s team brings the compliance expertise and documented methodology to give your study results you can act on and defend.
Explore Dickson’s Mapping Services →
Watch the “Audit Ready in Any Season: Modern Mapping & Validation” Webinar →
Get Dickson’s Complete Mapping Guide→
Related Blogs
The Cold Hard Fact: Seasonal Changes Require Seasonal Mapping
8 Steps to Compliant Temperature Mapping for Pharmaceutical Warehouses
The Hidden Risks of Built-In Incubator Sensors
Your CO2 incubator display says everything is fine. Temperature steady. Humidity on target. CO2 holding at 5%. But that display only tells you what the incubator thinks is happening inside the chamber. …

Avoiding 7 Common Mistakes in Temperature and Humidity Mapping Projects
Temperature and humidity mapping is one of the most consequential studies your team will conduct. Yet even experienced teams routinely stumble on the same seven mistakes. From skipping…
5 Key Questions to Verify Your Environmental Monitoring System Is FDA Compliant
In pharmaceutical manufacturing, your environmental monitoring system is your first line of defense in protecting product quality and patient safety. But simply having one in...

The Temperature Mapping Duration Debate: How Long Is Long Enough?
For years, one of the most persistent gray areas in pharmaceutical validation was a simple question: How long does a temperature mapping study actually need to last? However,…
Ready to chat?
Talk To A Specialist
Our trained team of professionals is ready to help you through the compliance process from start to finish. Reach out today to start the conversation. Call (630) 563-4209 or send us a message.