



How to Place Data Loggers for Mapping Studies and 3 Ways Dickson Can Help
When it comes to temperature mapping, these two questions create the most confusion: how many loggers do I need, and where exactly should they go? In this article, we answer those questions and walk you through three ways Dickson can help you get the study done right.
Why Data Logger Placement Is Critical for Accurate Temperature Mapping
Data logger placement is a foundational step that shapes everything that follows in a mapping study. Get it right, and your study efficiently confirms your environment is compliant. Get it wrong, and you’re left with data gaps, irrelevant readings, or findings an auditor won’t accept. To set up your temperature data loggers correctly, focus on these three things:
Mapping Zones
Focus on areas where your products are actually exposed to temperature risk, not the full physical footprint of the room.
Mapping Heights
Include loggers across the top, middle, and bottom planes of every mapped space — because temperature varies vertically and a single-level study misses that entirely.
Mapping Rationale
You should have a documented reason for each position that connects placement decisions to risk, grid coverage, or environmental monitoring compliance requirements.
How Many Loggers Do You Need and Where Do They Go?
Two standards define the baseline for compliant placement of temperature and humidity data loggers: the World Health Organization (WHO) Technical Report Series 961 (Annex 9) and the International Society of Pharmaceutical Engineering (ISPE) Good Practice Guide: Controlled Temperature Chambers. Together, they establish the following guidance:
| Requirement | WHO | ISPE |
| Small room spacing | 1 sensor per 10 m2 | 1 sensor approximately every 9 meters |
| Large room spacing | 1 sensor per 30 m2 | 1 sensor approximately every 9 meters |
| Height distribution | Low, mid, high if room exceeds 3 meters | Bottom, middle, top layers above 3 meters |
| Placement focus | Where products are stored, not just geometric coverage | Geometric logic combined with operational risk |
It’s important to remember that these are general guidelines, not hard-and-fast requirements. ISPE’s logger counts are rooted in two geometric frameworks: the 9-point rule (single horizontal plane) and the 27-point rule (grid extended across bottom, middle, and top planes).
Your actual logger count and placement should be based on the specific risks and operational conditions in your space.
How to Build Your Mapping Grid
After you determine your usable volume (the zones where temperature-sensitive goods are actually stored or staged), you can then establish your placement grid:
- Place temperature sensors/data loggers in all corners of the mapped space
- Add at least one at the center
- Position a temperature probe at the lowest and highest points where products are stored, including the top shelf and tallest packaging heights
- In spaces taller than 3 meters, add a mid-height sensor approximately halfway between those two points
Dickson’s general rule of thumb is to place data loggers every 7 to 9 meters (approximately 25 to 30 feet), distributed three-dimensionally across each zone. This approach applies across warehouse mapping, laboratory temperature monitoring, cold chain temperature monitoring, and any other regulated storage environment.
Add Risk-Based Corrections
After establishing the grid, add temperature sensors/data loggers to cover specific risk factors in three categories:
Technical risks
Areas such as HVAC vents, fans, exterior doors, and around heat-generating equipment that shift surrounding conditions
Operational risks
High-traffic zones, areas with frequent door cycling, or locations where products are placed temporarily but regularly
Compliance risks
Locations flagged in past audits, known hot or cold spots from prior studies, or areas where WHO or ISPE guidance calls for additional coverage
Once risk corrections are added, review for overlap. Instead of stacking multiple data loggers vertically in one spot, stagger them so they are low on one side of the row and high on the other. This maintains vertical coverage across the space while reducing total logger count without compromising environmental monitoring compliance.
Document the Rationale for Every Sensor
Each logger must have a documented reason for its placement. That can include grid coverage, a specific risk factor, or a regulatory requirement. That rationale belongs in three places: your floor plan, your logger placement table, and your mapping protocol.
The Dickson Mapping Suite handles all three. Once data loggers are placed on the digital schematic, annotation fields let you document horizontal placement, vertical placement, space information, and comments for each pin directly in the software. This information is saved automatically and included in the GxP-compliant report generated at the end of the study.
How the Dickson Mapping Suite Makes Placement Visual
Mapping Suite turns the framework above into a drag-and-drop exercise, dramatically simplifying temperature mapping. Upload your floor plan (.PNG, .JPEG, or .PDF) and the interface renders it as your working canvas. Place digital pins on the blueprint where each data logger goes, either one at a time or all at once using bulk placement for large facilities.
SEE HOW MAPPING SUITE SIMPLIFIES DATA LOGGER PLACEMENT
One click on “Auto-Assign Data Loggers” pairs each pre-calibrated Cobalt X logger to a specific pin. The logger’s screen updates to display its assigned location, and your team reads the device and places it. There’s no need for manual cross-referencing.

Working with a chamber or refrigerator? The 3D Elevation View maps your space across three labeled levels — Top, Central, and Bottom — and assigns a logger to each one, so vertical coverage is built into the study from the start.

New to the platform? Dickson’s Mapping Quick Start Guide and Create Mapping Study Guide walk you through every stage.
Three Ways to Map with Dickson
#1 DIY with Dickson Mapping Suite
Best for teams who want full control and plan to run multiple studies per year.
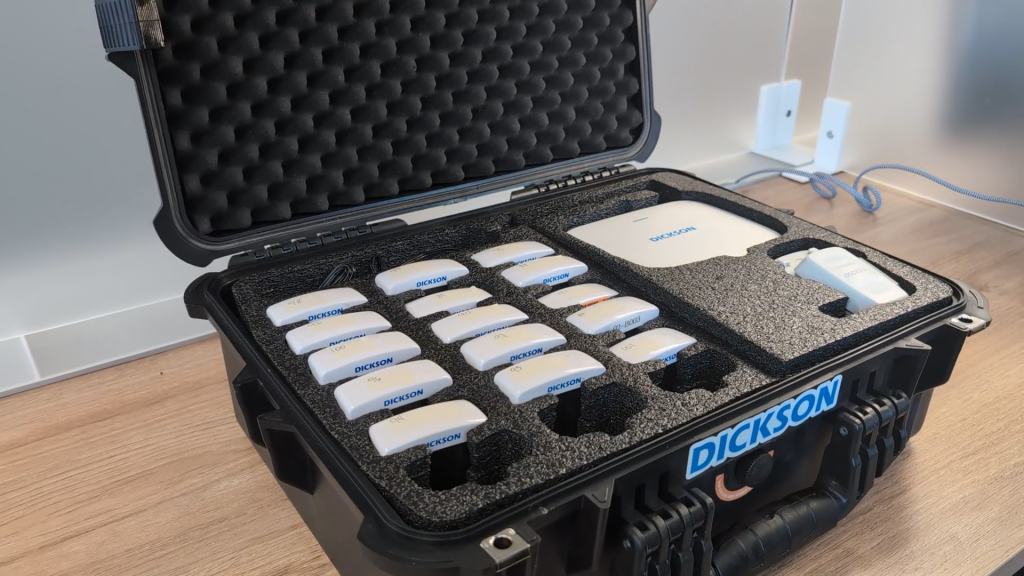
Each kit ships pre-configured with Cobalt X data loggers, temperature and humidity sensors, a gateway, and a cellular SIM card. Run unlimited studies on subscription, generate WHO/ISPE/21 CFR Part 11-compliant reports in one click, and reuse schematics and settings every season. This is the most cost-effective temperature mapping solution for teams comfortable managing their own studies.
#2 Guided Remote Support
Best for teams comfortable placing and retrieving loggers but who want expert guidance.
Your team handles the physical work. Dickson’s compliance experts support you remotely through study configuration, placement guidance, and report generation. This provides you with more accountability than software alone, at a lower cost than full on-site service.
#3 White Glove Full Mapping Service
Best for teams who want Dickson to handle everything.
Dickson’s in-house GxP and metrology team, led by a VP of GxP and Compliance with over 25 years of industry experience, manages every stage from initial consultation through post-study documentation, including hot- and cold-spot analysis and permanent monitoring placement guidance. Dickson never outsources mapping studies.
Let’s Discuss Your Mapping Needs
The right mapping approach depends on your team’s experience, your facility’s complexity, and how much support you want along the way. Dickson can meet you wherever you are in that spectrum.
Visit DicksonData.com/Mapping or contact Dickson to learn more about Mapping Suite or to schedule a temperature and humidity mapping consultation with our team of experts.

Modern Mapping and Validation Webinar Recap
Did you miss our recent “Audit Ready in Any Season: Modern Mapping & Validation” webinar, or want to revisit the highlights? We’ve got you covered….
Dickson Mapping Suite Webinar Recap
Smarter Thermal Mapping: Where Automation Meets Audit-Readiness Thank you to everyone who joined us for our recent webinar, “Smarter Thermal Mapping: Where Automation Meets Audit-Readiness.”…

Temperature Mapping: A Critical Process for Maintaining Compliance
In regulated industries, we often encounter materials and processes that are highly sensitive to temperature and humidity. The storage of certain pharmaceuticals is one example….

Why Is Temperature Mapping in Pharma Important?
A growing trend in the pharmaceutical industry is the development of more complex and fragile products, like biologicals, chemical mixtures, and large molecules (COVID-19 vaccines…
Ready to chat?
Talk To A Specialist
Our trained team of professionals is ready to help you through the compliance process from start to finish. Reach out today to start the conversation. Call (630) 563-4209 or send us a message.