


This website uses cookies to help us give you the best experience when you visit.
By using this website you consent to our use of these cookies.
Support
Welcome to Dickson Support! How can we help?
Interface
Articles
- Custom Dashboards
- Dashboard
- Monitoring Points
- Add or Remove Reference Lines
- Events Log / Audit Trail
- Sensor Information and Behaviors
- Understand the Device Graph
- Floor Plans
- Equipment
Creating a Custom Dashboard
About Custom Dashboards
- Custom Dashboards provide the ability to create a tailored view of data.
- Users may override the default view, which displays upon login, with their created Custom Dashboards.
- Users may limit who can view their custom dashboards with sharing controls.
How to Create a Custom Dashboard
- From the Overview screen, select Create Custom Dashboard in the top right corner.
- Begin by entering the Custom Dashboard Name.
- Select a pixel Display Size
- Small – 1920×1080 (Chromebook or similar)
- Medium – 2160×1440 (External computer monitor or similar)
- Large – 3840×2160 (4K TV or similar)
- Choose how you plan to utilize your display by choosing Horizontal or Vertical orientation.
- Choose the Time Zone where the display will be mounted.
- Select a Time Frame of Reference, which filters out loggers that have not reported data within the specified time frame.
- Select Create Custom Dashboard.
Widgets
About Dashboard Widgets
- Custom Dashboards can be composed of any combination of Location, Floor Plan, Logger or Equipment, Channel, or Alert widgets.
- Widgets may be resized, rearranged, or deleted to fit the specific needs of your dashboard.
Currently available widgets:
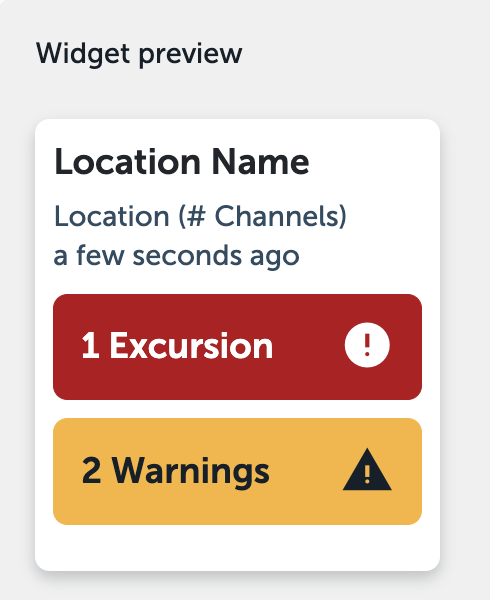
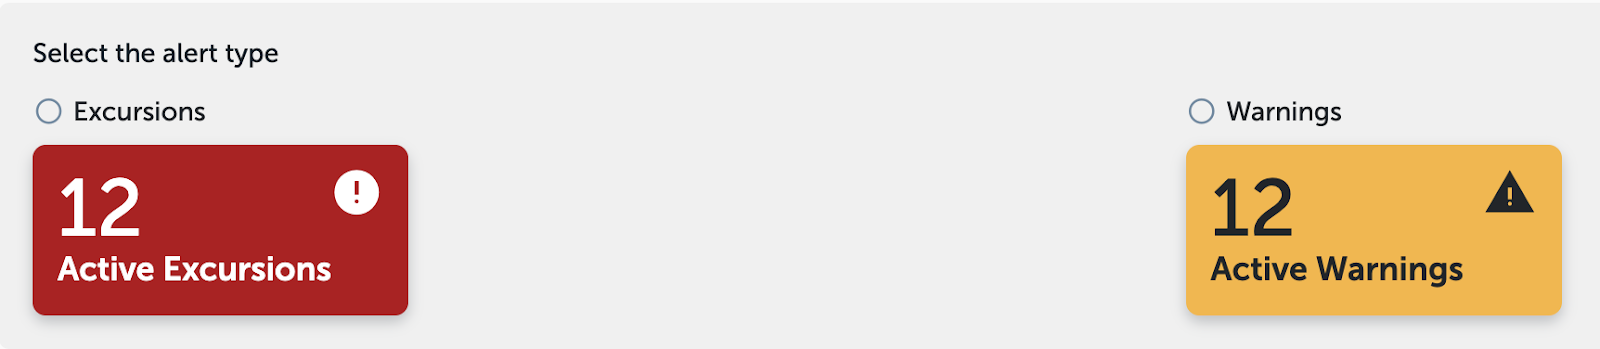
- Location – Location widgets provide at a glance status for the selected location. It will show active Warnings, Excursions, or Safe if there are no Warnings or Excursions to note.
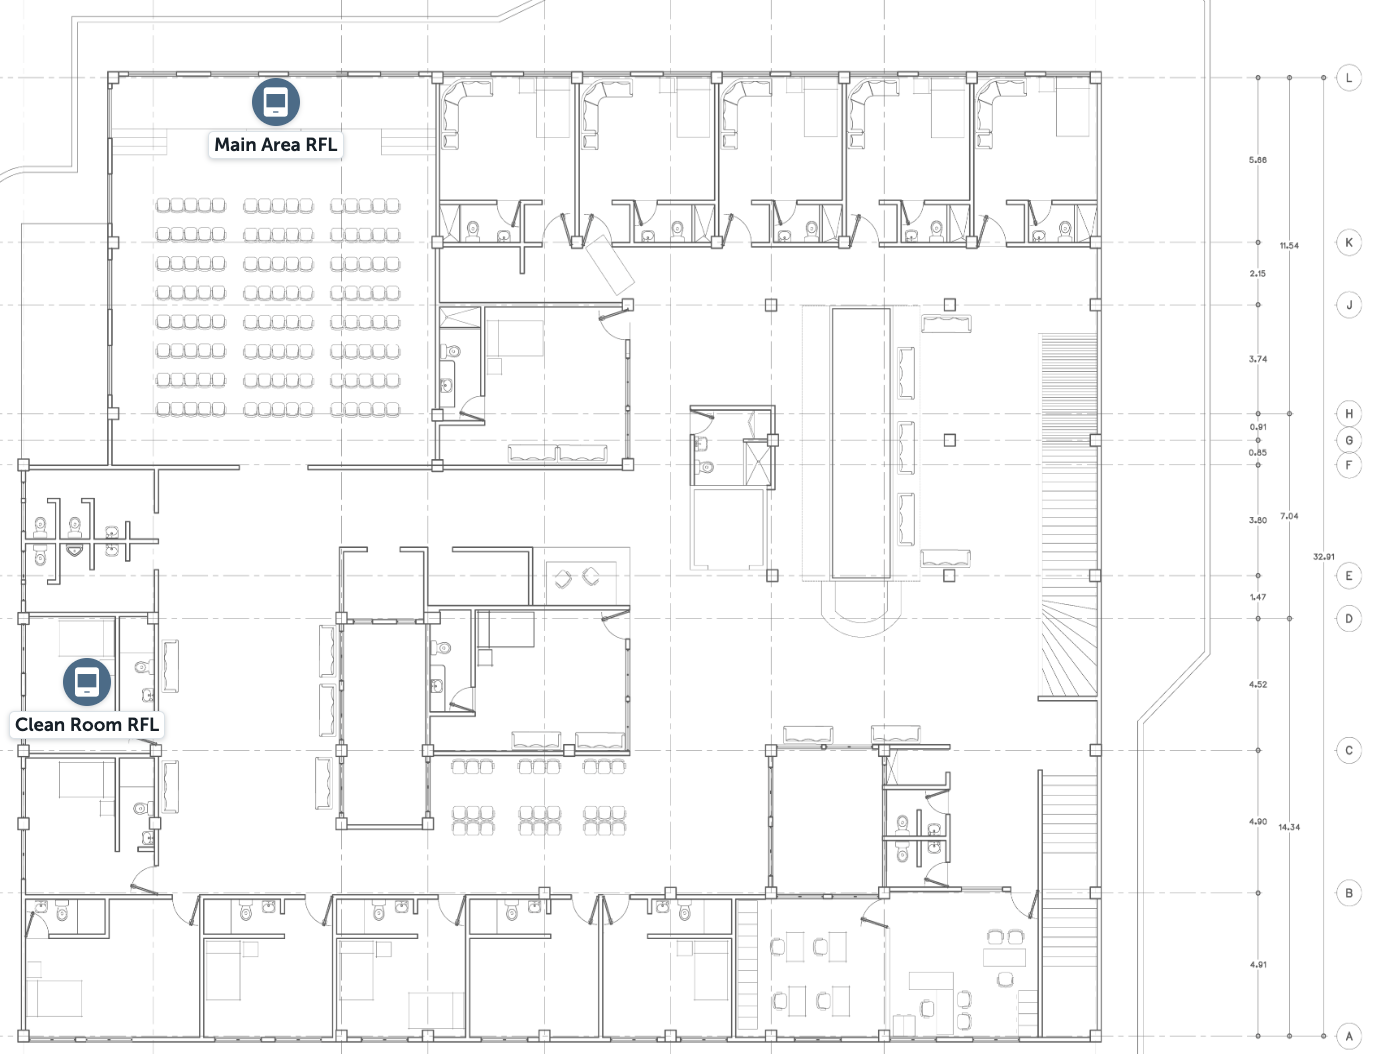
- Floor Plan – Floor Plan allows you to monitor the live status of equipment or specific data loggers which can be placed on a schematic of your space. Be sure to upload a floor plan via the Monitoring Points > Floor Plans > Add Floor Plan. Read more about floor plans here.
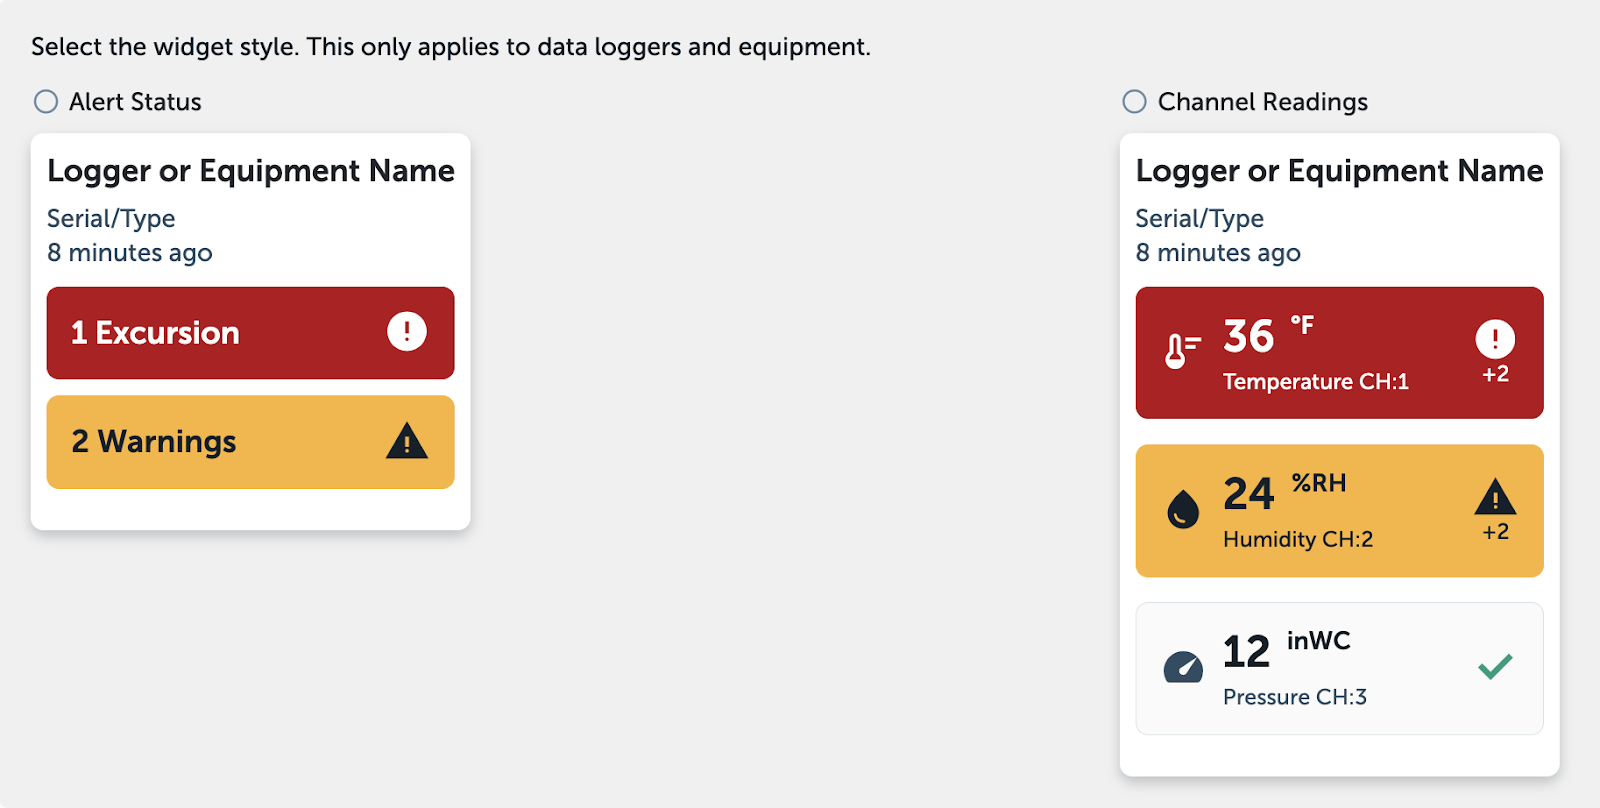
- Logger or Equipment – View a data logger or equipment from selected monitoring points. In the widget preview, you may decide if you want to see Alert Status or Channel Readings.
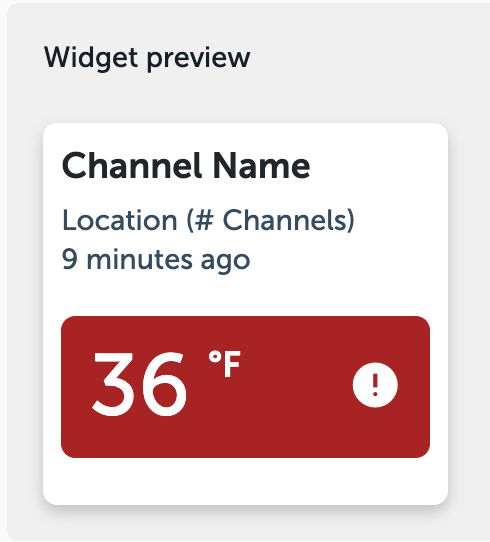
- Channel – Allows you to monitor specific channels (Temperature, Relative Humidity, Air Pressure) separated from locations, loggers, or equipment. A great option for focusing in on near real-time data for a single monitoring point.
- Alerts – This widget presents at a glance views of active Warnings or Excursions for the entire account.
To add widgets:
- From the Custom Dashboard, choose Edit
- Select Add Widget, then choose the widget type you would like to add.
- Once you have selected the widget type, you will see a preview where when applicable, you may need to make a selection on the style and contents of the widget.
- Choose Add, then the widget will be added to your Custom Dashboard.
To resize or rearrange widgets:
- From the Custom Dashboard, choose Edit.
- In the Edit view, you have the ability to click and drag the widget tiles. Keep in mind the display area cut-off zones.
- The bottom right corner of the widget tile has a small carrot, which can be used to adjust the size of the widget tile.
- To delete a widget, select the overflow menu (the dots) in the top right of the tile and then choose Delete.
- Any changes will be saved automatically.
Sharing and Transferring Ownership of a Dashboard
About the sharing of dashboards
- Custom Dashboards may be shared with others or shared with specific devices which enables displaying the dashboard at a central monitoring hub, for example.
- Ownership of Custom Dashboards may also be transferred to another user, useful if a dashboard owner were to leave an organization.
- Dashboard sharing can be configured for different security needs
To share a custom dashboard:
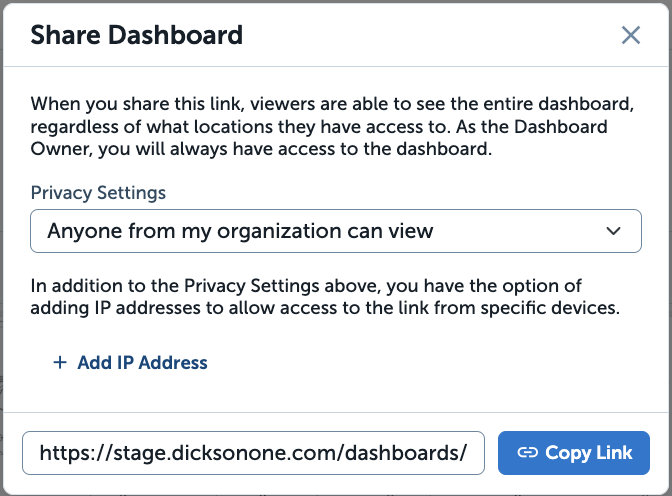
- In the top right corner of the page, select Share.
- From the popout, choose your desired privacy settings
- Only devices from approved IP addresses below and I can view – This is the most secure option.
- Anyone from my organization can view.
- Anyone with the link can view – This is the least secure option.
- If Only devices from approved IP addresses was selected, identify approved addresses with the Add IP Address field
- Once you have finished adjusting the settings, select Copy Link.
- Share the link to the Custom Dashboard with applicable users.
Note: depending on the settings configured above, the dashboard may be visible outside your organization. Review the instructions and settings carefully to ensure confidentiality.
To transfer ownership:
- From the Custom Dashboard, choose Edit.
- In the Edit view, select the Settings tab.
- Scroll down to the bottom of the Settings tab and choose Transfer Ownership.
- In the popout, choose the desired Dashboard Owner from the dropdown menu.
- Finalize the change by selecting Transfer.
Deleting a Custom Dashboard
- Custom Dashboards may also be deleted, providing the ability to remove obsolete dashboards or keep the dashboard dropdown organized with only dashboards that are needed.
To delete a custom dashboard:
- From the Custom Dashboard, choose Edit.
- In the Edit view, select the Settings tab.
- Scroll down to the bottom of the Settings tab and choose Delete Dashboard.
- In the popout, choose Delete.
About the Dashboard
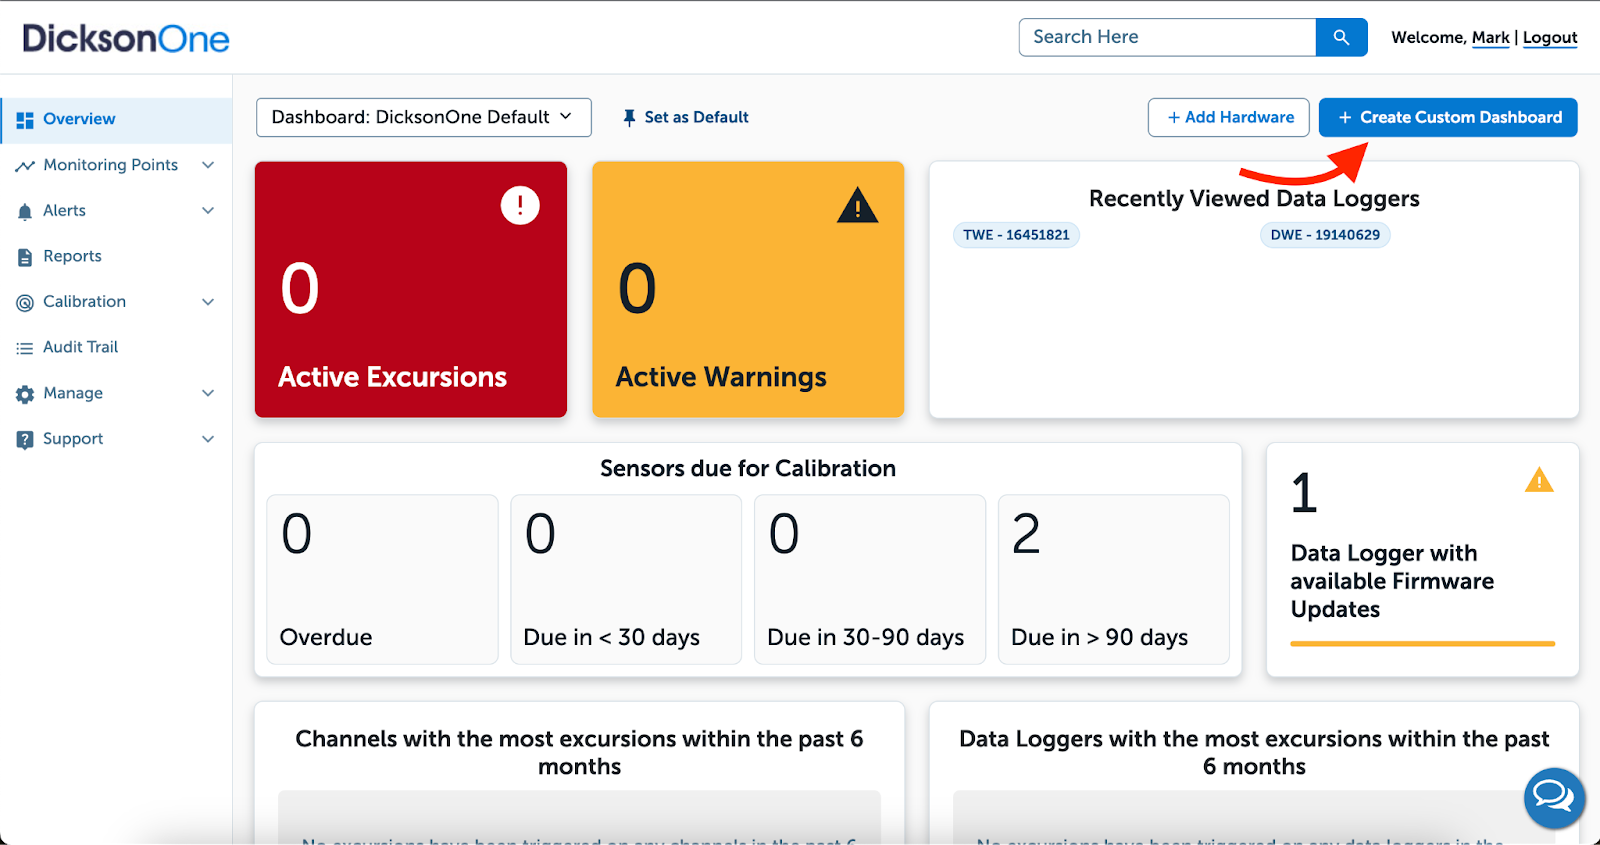
- The DicksonOne landing page is now the DicksonOne Overview Page and Dashboard.
- The DicksonOne Dashboard highlights actionable items to get you the information you need to take action.
- The Dashboard includes Active Excursions and Active Warnings, Firmware Updates, various metrics on your monitoring points and more.
- Click into a Dashboard card and you are taken to a related page that covers more insight.
- Go to Monitoring Points to learn more on how to get to the previous DicksonOne Locations landing page.
Dashboard Overview

This article applies to these plans:
Basic
Standard
Compliant
About Monitoring Points
- Users can navigate their monitoring points in various ways.
- The goal of Monitoring Points is to allow different views that bring attention to critical matters, and prioritize monitoring points based on criticality
- Monitoring Points by Locations used to be the DicksonOne Locations landing page, which now lives under ‘Monitoring Points.’
How to use Monitoring Points
Monitoring Points > Locations
This is what the DicksonOne landing page used to look like once a user logged in.
- To arrive to the locations destination, click on Monitoring Points on the left-navigation bar and then click Locations
- You can continue to Register Devices from this page and can continue to organize your monitoring points through virtual locations

Monitoring Points > Devices
Devices with active Excursions and/or Warnings are prioritized to bring attention to critical matters.
- Click on settings and jump to the Overview, Alarms, or Settings pages
- Once you click into the Menu option, you can also create an Export
- Use the Search Devices bar to locate a specific device

Monitoring Points > Channels
Channels with active Excursions and/or Warnings are prioritized to bring attention to critical matters. Channels can be a temperature probe that goes inside a refrigerator or a temperature channel that monitors the ambient temperature in a room.
- Click on settings and jump to the Overview, Alarms, or Settings pages
- Once you click into the Menu option, you can also create an Export
- Use the Search Devices bar to locate a specific device

Note
Monitoring Points > Channels is soon to come. It will highlight the various channels that need your attention throughout the account as well as allow you the ability to search for channels by name.
About Adding/Deleting Reference Lines
- As part of best practices, we recommend that Reference Lines are added when building a Custom Alarm so that the Reference Line is tied to an Excursion threshold or Warning threshold.
- Reference lines can help provide a visual on graphs when needing to monitor specific Temperature and/or Relative Humidity parameters.
- You can add multiple lines for each channel.
How to Add or Delete Reference Lines
Visit a Device to Add/Remove Reference Lines:
Adding a Reference Line.
- On the Device Overview page, click on ‘Reference Lines.’
- Click ‘+New Reference Line’ to add a new line and follow the next steps.
- To Delete an existing Reference Line click ‘Delete’ or if you wish to change the value of the existing Reference Line, click ‘Edit.’

Determine the Parameters:
Input the Values needed.
- Select the Channel for the Reference Line.
- Determine the Value you want to set the Reference Line to.
- Click on ‘Create’ and then close out the popup window.

Note
Temperature y-axis is displayed on the left-hand side of the graph and the Humidity y-axis is displayed on the right-hand side of the graph.
Reference Line Displayed:
The Reference Line will appear as a dashed line across the x-axis of the graph.

Success
You can now add Reference Lines on the Device Overview graph. Please visit the DicksonOne Knowledge Base to learn more on How-to Build a Custom Alarm.
About Events Log
- The Events Log automatically records information about how an organization is using the DicksonOne system.
- The Events Log is an important feature for organizations in highly compliant environments. Creating an audit trail that can be referenced at any time.
How to use the Events Log
The user name, time, date, device (when applicable), and a brief notation are added to the log when any of the following events occur:
- Users log in or out of the DicksonOne Web Portal
- Device or location information is added or changed
- Alarms are added or changed
- Users are added or their permissions changed
- Data is exported
- Annotations are made or changed in the graph area.
- To view the Events Log, click Events on the left of the page.

On the events page you’ll see the following:
- Time Zone – changes the time zone the events are reported in (defaults to browser’s time zone).
- Filter – filter the results to exactly what you want.
- Export – export all events or just a filtered set to a CSV file.
- Event Detail – Each line is an individual event or set of changes.

Filtering:
You can filter the audit trail based on a number of things:
- A specific device or set of devices
- A specific user or group of users
- Type of event
- Date range

Details:
The event log captures a number of different types of data including:
- Account – anything relating to account settings
- Alarm – anything related to the creation, deletion, editing, pausing, commenting, or acknowledgement of an alarm
- Annotation – a user has added an annotation to the graph of a device
- Device – a user has added, deleted, or edited a device
- Export – a user has exported data for a device
- Location – A location has been added, deleted, or edited
- User – A user has been added, deleted, or edited
- Report – A user has created, deleted, or edited a report
- System – The system has performed an action based on alarms or other programmed behavior (this includes alarms that were triggered)

Note:
You can only track events for users who have and use their own account.
This article applies to these plans:
Basic
Standard
Compliant
About Understanding Sensor/Calibration Information on DicksonOne
- When replacing sensors on a device, there are a couple of behaviors that may occur on the interface, and to understand those behaviors this article will explain some of the expectations and details
- When swapping sensors of the same model type, the channels on the interface should continue as one, and when they are different model types the behavior may change
- Sensor information regarding when sensors where calibrated and the previous sensors that have been connected to a device are found on a Device Settings page
Understanding Sensor Swapping and Sensor History
Section 1: Same Model Swapping
When sensors of the same model type are swapped on a device, i.e., RTHM (Glycol Thermistor Sensor), the graph will continue as the same line for the sensor on the interface

If an RTHM sensor is swapped with another RTHM sensor, the channel will be displayed as one on the graph

Section 2: Different Model Swapping
Section 2:
When a different sensor model type is swapped on a device, the graph will display two channels (one for each model type), and the lines of the graph may have a splitting point in which they will appear in a different color from one another and may read a slightly different temperature

An RTHM (Glycol Thermistor) which is a sensor for temperature is swapped with an RKTC (K-Thermocouple) sensor which is also for temperature will be displayed as two different lines on the graph

Note: Please continue to read below to review more information on Sensor Information
Section 3: Reviewing Sensor History
To identify when sensors have been removed and replaced with new ones on a device, go to the Device Settings page > click on Sensor History
- Current Sensors attached to the device are documented
- The port number will be displayed (1 port only for DWE models and 2 ports for TWE/TWP models)
- The Channels that you name your sensors on the graph will be displayed here
- Calibrated date includes when the sensors were calibrated at Dickson
- When the sensor last reported to DicksonOne
- Sensor History will include the current sensors attached to the device as well as previously attached sensors that have reported through the device

Success
About Understanding the Device Graph
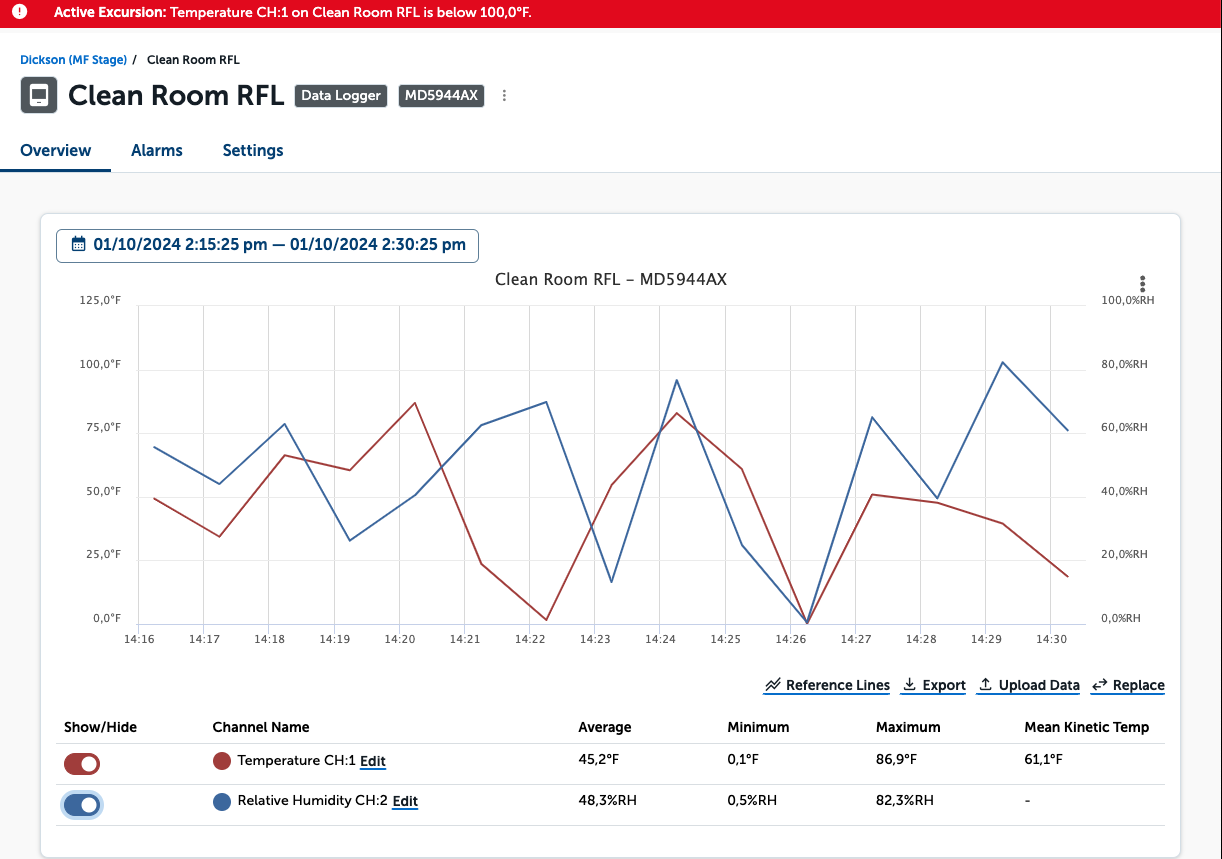
- The Device Graph can provide users insightful information such as Excursion flags, the ability to create Annotation flags, display different data ranges and more all on the graph.
How to Understand the Device Graph
Displaying the Data on the Graph:
- Click on the date picker to determine a display a different range of data
- By hovering over the screen, you can look at a data point on the graph
- A timestamp for the data point that the cursor is on will be displayed on the top-right
- You can hide other channels by sliding the toggle to Off to display only desired channels on the graph

Zoom Into the Graph:
- Highlight an area on the graph by clicking into the graph and dragging the cursor to zoom into a range of data
- Click Reset Zoom to reset the zoom

Warnings and Excursions on the Graph
- Excursion events will add excursion flags on the graph and you can click into it to view more details
- An excursion banner will be displayed when an alarm event for an excursion is triggered and will remain displayed until the condition clears
- A warning banner will be displayed when an alarm event for a warning is triggered and will remain displayed until the condition clears

Info
Users have the flexibility to designate alarm alerts as either warnings or excursions. Warnings are typically used to receive a notification when a condition is trending out of spec, but has not reached a critical point. Excursions are typically used to alert the user when the condition has reached a critical point. All warning and excursion events will be documented in the system. However, only excursions will display a flag on the graph and appear on export and reports. Warnings will not.
Annotations on the Graph
Users can add Annotation flags by clicking into the graph and the Annotation pop-up will be displayed
- Select the Channel from the drown-down to comment on
- Create a message/comment
- Click Save

Success
There are various options that can be displayed on the Device Graph. To learn more information, such as how to add Reference Lines to the graph or other features, please visit the DicksonOne Knowledge Base.
About Floor Plans
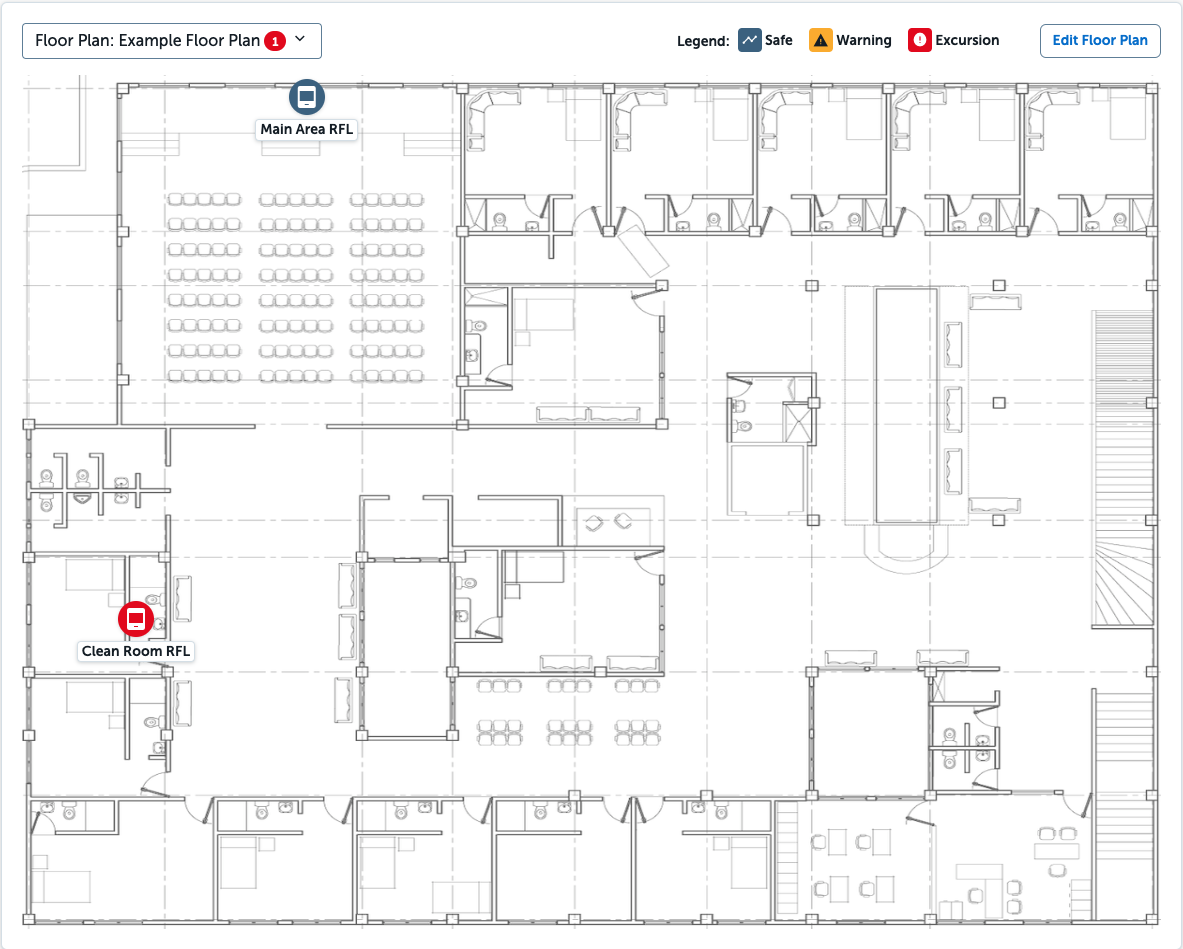
- Floor Plans allow users to visualize their monitoring point and real-time status on a schematic of a chamber or facility.
- Floor Plans can be monitored via the Floor Plan page, Locations page, or via added to Custom Dashboards.
- Floor Plans can visualize Locations, Equipment, or Data Loggers along with their Healthy, Excursion, or Alerting statuses.
Getting Started with a Floor Plan
- In the navigation, select Monitoring Points > Floor Plans.
- Choose Add Floor Plan and Drag and Drop or choose Browse. Currently, PNG, JPEG, and PDF file formats are supported.
- Once you have selected the floor plan, a status bar will show that the file is successfully attached. Select Add Floor Plan to complete the upload.
- You will land on the Edit Floor Plan page where your uploaded file will appear. This page is where you may place existing Location, Equipment, and Data Loggers throughout the floor plan, or add new Location, Equipment, or Data Loggers to your account.
- As you add Location, Equipment, or Data Loggers you may drag and drop them around the floor plan to place them in their respective positions.
- Scroll to the bottom of the page and select Done.
- Now that you have set up a Floor Plan, you may add it to a Custom Dashboard or view it in the Floor Plan or Location tabs of Monitoring Points.
Note: Keep in mind that you may only place monitoring points that you have read or edit access for. Additionally, other users may have visibility into devices that are placed on a floor plan that their permissions otherwise may not be entitled to.
Placing Monitoring Points
About Monitoring Points
- Monitoring Points may be added while creating a floor plan or after one is created via the Edit Floor Plan page.
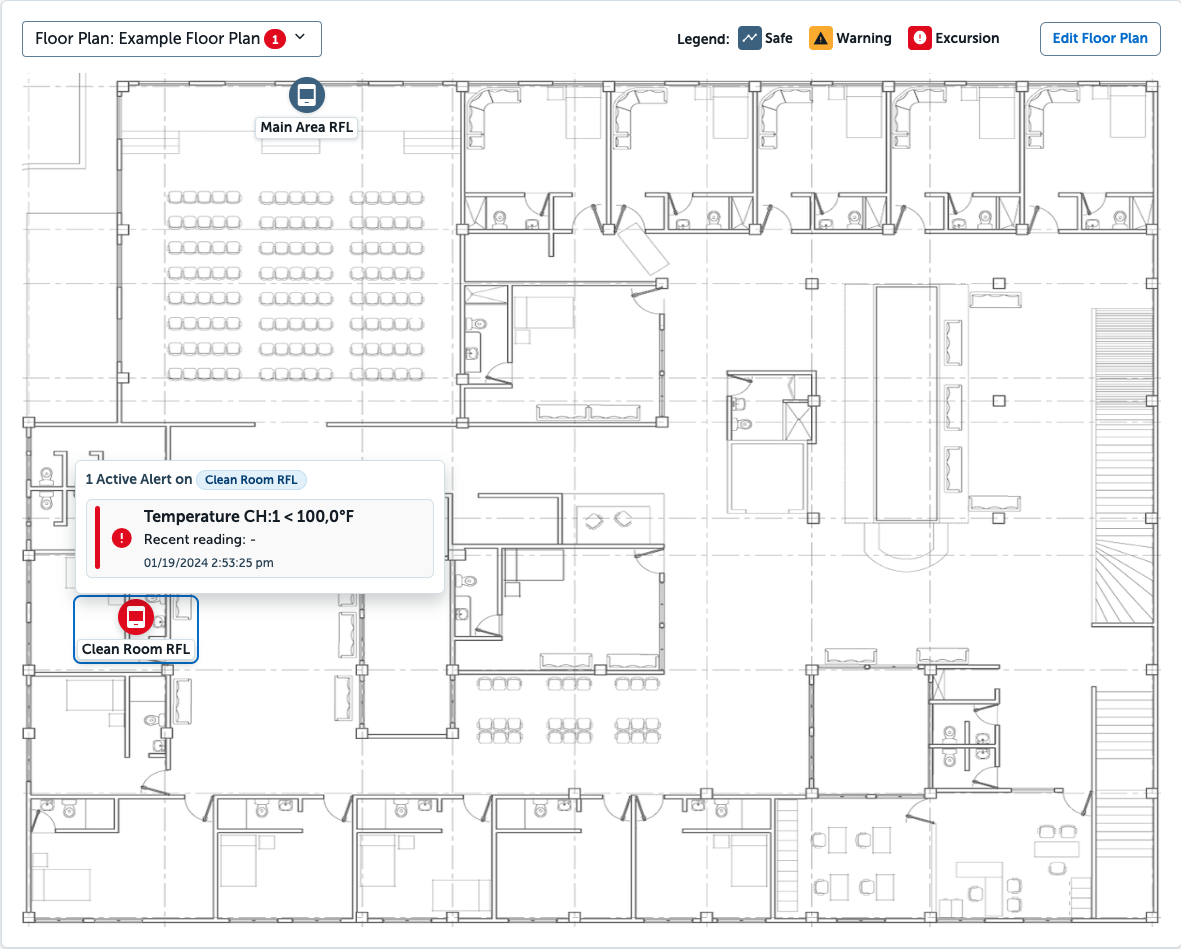
- Monitoring Points will show their status and may be clicked to reveal more information or navigate to the respective page.
To place monitoring points:
- From the Floor Plans page, select Edit Floor Plan
- If you are placing an existing Location, Equipment, or Data Logger select the corresponding dropdown and select from the results
- If you would like to place a new Location, Equipment, or Data Logger, select the Create New dropdown and choose your intended monitoring point. Follow the prompts for your selected monitoring points
- The monitoring point will appear in the center of the floor plan, click and drag to move to your desired location within the floor plan.
- Repeat adding monitoring points until you are satisfied, then scroll to the bottom of the page and select Done.
Editing Floor Plan
- Editing allows for moving existing monitoring points, adding new ones, or deleting monitoring points that are no longer needed.
- Within the Edit Floor Plan page, you may create new Locations, Equipment, or Data Loggers.
To edit a floor plan:
- From the Floor Plans page, select Edit Floor Plan
- In the edit view, you have the ability to click and drag monitoring points that have been placed on the floor plan.
- Use the Location, Equipment, or Data Logger dropdowns to add other monitoring points to the floor plan. If needed, use the Create New dropdown to add monitoring points to your account prior to adding them to the floor plan.
- In the top right, use the Floor Plan Name field to edit the floor plan’s name.
- Once satisfied with the changes, scroll to the bottom and select Done.
- To delete a floor plan, scroll to the bottom of the Edit Floor Plan page and select Delete This Floor Plan.
Audit Trail
- Floor Plan events will be logged in the Audit Trail, helpful for tracking any changes.
To view Floor Plan events in the Audit Trail:
- From the left-hand navigation, select Audit Trail.
- By default, all audit trail events will be displayed, filter down by selecting Floor Plan from the Event Types field and clicking Filter.
- Only Floor Plan audit events will be showing, clicking the carrot to the left of the date will reveal more details about the audit event.
About Equipment
- Equipment Views provide a new way to organize and visualize monitoring points, especially useful for a single device with dual probe sensors monitoring multiple pieces of equipment, or having more explicit naming conventions for monitoring points.

- Equipment Views are flexible with 9 pre-defined Equipment Types, or the ability to add a Custom Equipment Type if the predefined options do not cover your use case.
Getting Started with Equipment
- Navigate to the Monitor Equipment page by clicking Monitoring Points > Equipment.
- Select Create Equipment to begin.
- Provide a name for the equipment, we recommend being as detailed as possible here utilizing any naming conventions leveraged by your organization.
- Choose your Equipment Type or Custom if one of the provided options does not exist.
- Select the Location that this piece of Equipment is a part of, or create a new location. This is important for the overall organization of monitoring points.
- Search for and connect equipment to channels, which will enable monitoring and alerting. This may also be adjusted later on. Decide if you would like to only include channels in the same location, or if you plan to connect channels from different locations.
- Click Create Equipment to save. You will be directed to the Monitor Equipment page and your equipment will be available for monitoring.
- Now that you have created equipment, you may add them to your Custom Dashboards.
Note: If you opt to connect channels from different locations, other users in the organization may be able to view the channels even if they do not have access to the locations themselves.
Pro Tip: Make sure you have existing devices and channels named in such a way that you’ll be able to easily search for and distinguish them from one another when attaching them to equipment.
Equipment Alarms
About Equipment Alarms
- Alarm Templates may be applied to Equipment, with the exception of not reporting alarms, which are tied to specific devices.
- Equipment alarms allow for specific naming of assets to better represent the scope of the alarm for more efficient triage.
To apply an alarm to existing equipment:
- Select Monitoring Points, then choose Equipment
- On the equipment you would like to apply the alarm, click the three dots to open the overflow menu and choose Alarms.
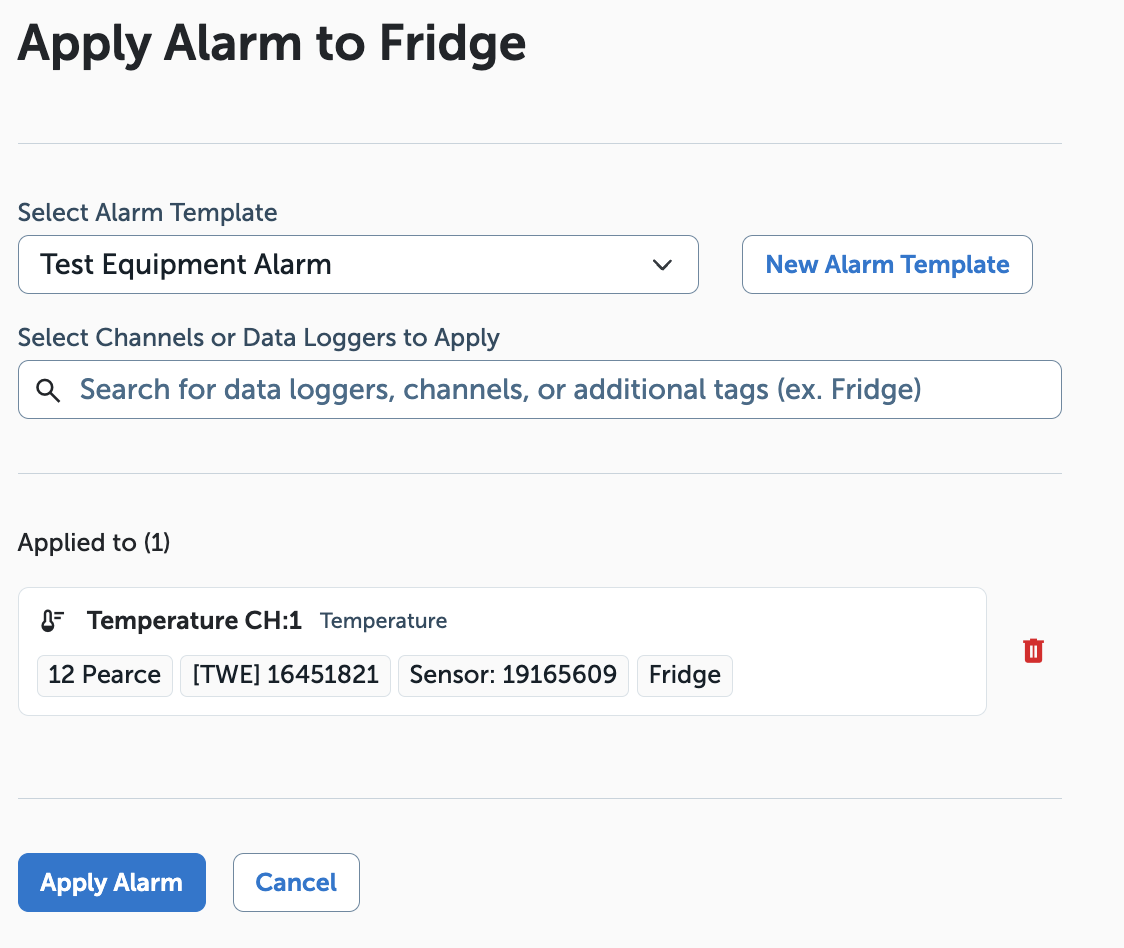
- Click Apply Alarm, select an existing alarm template or choose to create a new alarm template.
- From the dropdown menu, choose the channel or data logger. Once you have added all intended channels or data loggers, choose Apply Alarm.
- You will be taken back to the Alarm page for the equipment where you can edit or unapply the alarm as needed.
Reports
- Equipment may be included in Reports, allowing for additional granularity and personalized naming conventions to appear in the generated reports.
To create a report with equipment
- From the left-hand navigation, select Reports.
- Click Create a New Report
- Choose a Report Type
- Search for and select the monitoring points you would like included in the report. Select the checkbox if you would like only equipment to be included for selected Locations instead of Data Loggers. This provides the equipment naming and granularity in the generated report.
- Provide a Report Name, adjust the time zone if needed, choose the frequency of the report, and the date you would like the first report delivered. Identify the email address you would like the report sent to and add any other necessary recipients.
- Select Save and Continue. Confirm all details are accurate on the Summary page, then click Save and finish.
Audit Trail
- Equipment events will be logged in the Audit Trail, helpful for tracking any changes.
To view Equipment events in the Audit Trail:
- From the left-hand navigation, select Audit Trail.
- By default, all audit trail events will be displayed, filter down by selecting Equipment from the Event Types field and clicking Filter.
- Only Equipment audit events will be showing, clicking the carrot to the left of the date will reveal more details about the audit event.
Need expert help?
You can contact us via any of the following